Limits of the basic GDB interface
The main user's complain about gdb is the lack of a friendly interface. The basic interface is command line based, alternating just one line of information with the command entering prompt.While debugging complex source code, it is quite annoying to be able to see only one line of source, without any context. The list command allows to print few lines of source code around the currently executing line, but alternating the next command with the list one is, again, not very productive. Graphical debuggers, like ddd, offer a more rich interface to gdb, but I'm used to debug over a terminal connection and ddd requires an X server.
The solution is an additional gdb built-in interface that offers a better debugging experience: TUI (text user interface).
Introduction to TUI
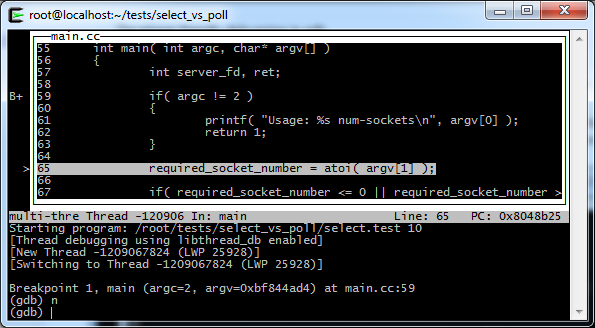
The TUI interface can be enabled either starting gdb with the -tui switch or by pressing the Ctrl-x Ctrl-a key sequence.The result is a curses based interface that splits the terminal into two sections. The upper one shows the source code, while the lower one contains the usual gdb command line interface:

After starting the program, the interface shows the next executing line and the set breakpoints. B+ indicates an hit breakpoint, while the > symbol indicates the next line to execute. The arrow keys allow to scroll across the source code:
It is also possible to replace the source code with windows containing other information. For example using the layout regs command it is possible to show the registers status window. The command focus regs assigns the focus to the registers window, allowing to scroll across the registers using the arrow keys.
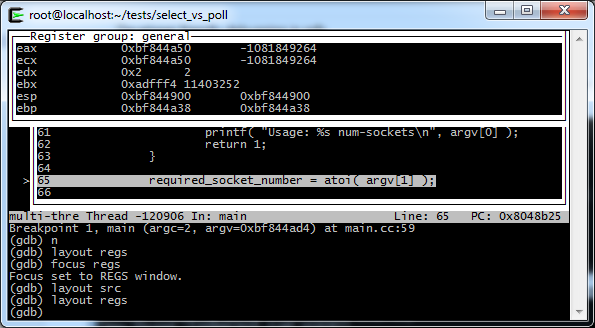
Entering the command layout src the source code returns in foreground and it is possible to continue debugging.
The TUI interface, being curses based, works fine only if the terminal is properly configured: when debugging from a cygwin ssh connection, for example, I have to set TERM=cygwin in the terminal before starting gdb. Not setting the terminal properly results in the TUI interface scrolling in an incorrect way and corrupting the terminal.
The official documentation offers a complete overview of the commands and capabilities of TUI:
https://sourceware.org/gdb/onlinedocs/gdb/TUI.html
Compared with the basic gdb user interface, TUI is really more developer friendly and allows an higher productivity.
Compared with the basic gdb user interface, TUI is really more developer friendly and allows an higher productivity.
No comments:
Post a Comment